A simple guide on how to set and get synthetic monitoring to work in New Relic Software.
New Relic is a Powerful and Innovative platform, revolutionizing software development and performance.
By aggregating data from diverse digital sources, it provides comprehensive insights to deeply understand your system.
Analyzing this data efficiently allows you to respond proactively to incidents, preventing potential problems.
In this article, we’ll walk you through a simple step-by-step process of how to get synthetics monitoring to work in a new relic.
Synthetic Monitor Setup
Setting up synthetic monitoring in New Relic involves a few steps to ensure that you can effectively monitor your applications and services from different locations and simulate user interactions.
Prerequisites
Before you begin, ensure you have the following in place:
A New Relic account. If you don’t have one, sign up at https://newrelic.com/signup.
Step 1: Accessing Synthetic Monitoring
New Relic’s synthetic monitors act as a vigilant guardian for your website, constantly checking its performance.
It keeps track of various aspects, including an overall summary, detailed downtime incidents, and resource statistics.
- Navigate to the New Relic UI by visiting “One.newrelic.com.”
- Sign in with your New Relic account credentials.
- From the top navigation menu, select “Synthetics.”
Step 2: Creating a New Monitor
- Click on the “Create a monitor” button to start setting up a new monitor.
Step 3: Selecting Monitor Type
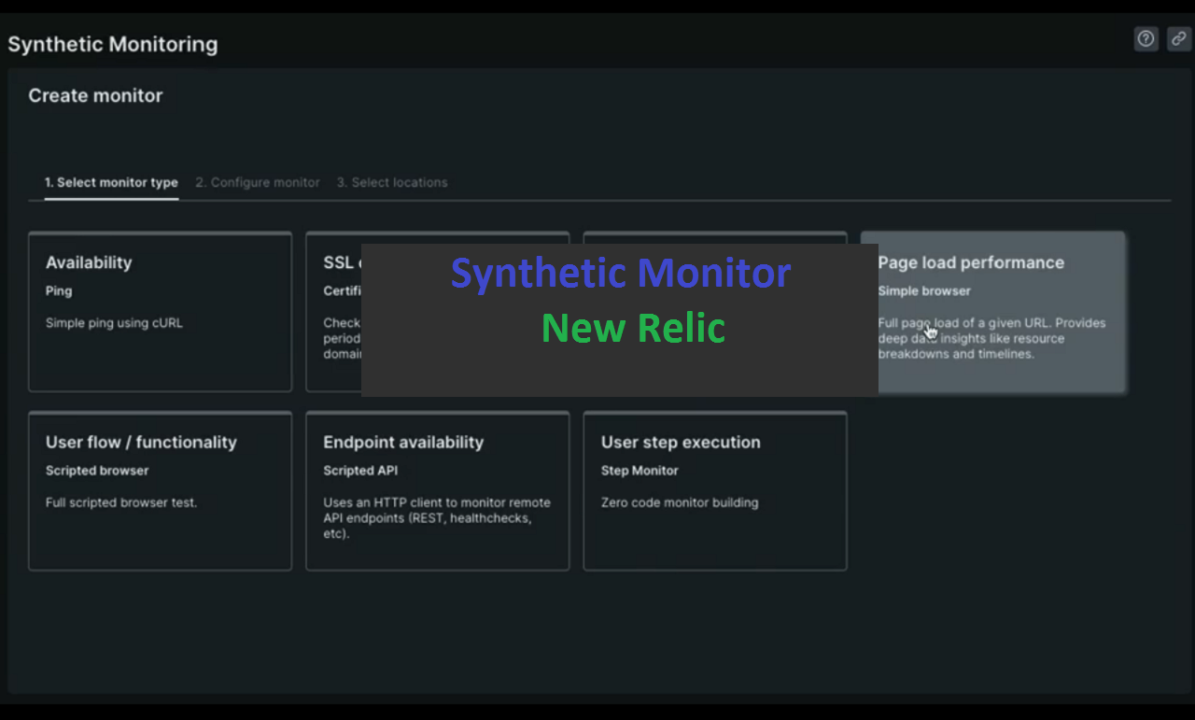
Choose the type of monitor you want to create based on your monitoring requirements:

- Broken Links Monitor: Provide a URL, and this monitor will test all the links on the page for success. Detect failures and view individual non-successful links that caused the failure.
- Certificate Check Monitor: Proactively ping your domain certificates based on a configurable threshold. Pair with an alert to ensure you receive notifications when certificate renewals are needed.
- Ping Monitor: The simplest monitor type that checks if an application is online. It uses a Java HTTP client to make requests to your site.
- Step Monitor: Configurable monitor to perform various actions like asserting modals, text, clicking elements, and dismissing modals.
- Simple Browser Monitor: Pre-built scripted browser monitors that make requests to your site using Google Chrome. Offers a more accurate emulation of an actual customer visit than a simple ping monitor.
- Scripted Browser Monitor: Used for sophisticated, customized monitoring. Create custom scripts to navigate your website, perform specific actions, and ensure specific resources are present.
- API Test Monitor: Monitor API endpoints and validate responses. Ideal for monitoring API functionality and app server performance in addition to your website.
Select the appropriate monitor type by clicking on it.
Step 4: Configuring the Monitor
To effectively set up Synthetic Monitoring in New Relic, follow the steps below for each monitor type:
1. Ping Monitor:
- Enter the URL or IP address for availability monitoring, such as your website’s homepage or an essential API endpoint.
- Choose whether to follow redirects based on your monitoring needs.
- Define alert thresholds for response time and availability to receive timely notifications.
2. Simple Browser Monitor:
- Enter the URL of the page to load in the browser for monitoring, such as a crucial landing page or key user workflow.
- Specify any required headers or parameters for the page load, if applicable.
- Set the time limit for page load and configure alert thresholds for load time and error rates.
3. Scripted Browser Monitor:
- Write a JavaScript script to simulate user interactions, navigate pages, interact with elements, and validate responses.
- Utilize the New Relic script editor with syntax highlighting and error checking for robust scripts.
- Thoroughly test the script to ensure accurate user behavior representation.
4. API Test Monitor:
- Enter the API endpoint to monitor, specifying the HTTP method and required headers or parameters.
- Set up response validations to ensure expected API results, checking response status codes, times, and specific data elements.
- Define alert thresholds for response time and validation failures.
5. Broken Link Monitor:
- Specify a name and URL for monitoring (valid HTTP or HTTPS URL).
- Select the monitoring frequency period.
- Optionally add tags for easy future identification.
- Choose monitor locations, then click “Save monitor” to confirm.
Step 5: Setting Monitor Locations

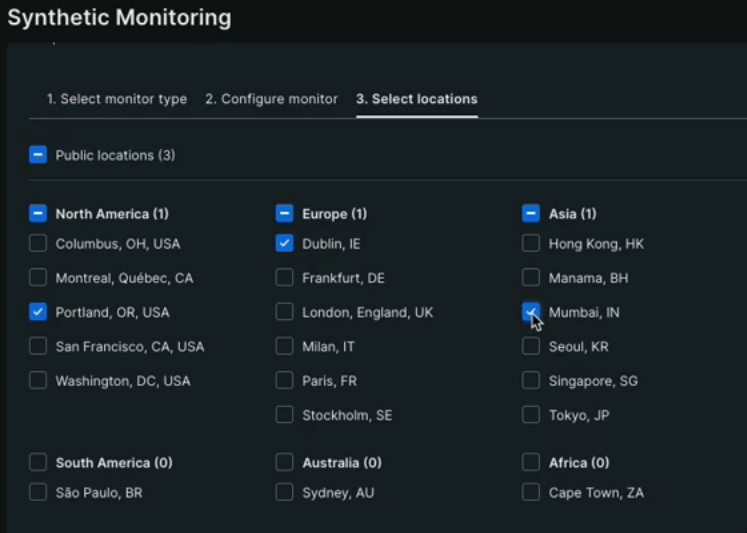
- Choose the locations from which you want to run the monitor. New Relic offers multiple global locations, allowing you to simulate user interactions from various geographical regions.
- Consider selecting locations that represent your key user bases or regions with high traffic.
Step 6: Setting Monitor Schedule

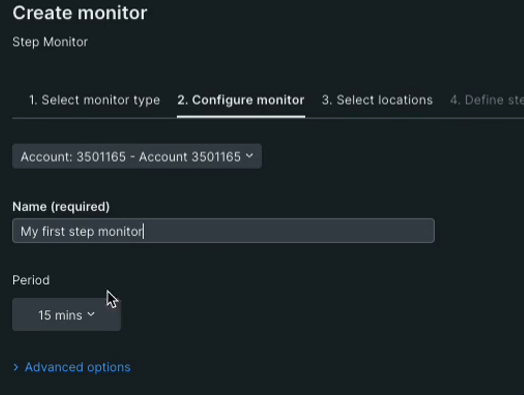
- Decide how frequently you want the monitor to run.
- Consider the trade-off between monitoring frequency and data volume.
- More frequent checks provide real-time data but may lead to higher data ingestion costs.
Step 7: Naming and Saving the Monitor
- Give your monitor a descriptive and meaningful name. This will help you identify the monitor easily, especially if you have multiple monitors set up.
- Consider adding tags to categorize the monitor based on application, environment, or any other relevant criteria.
- Click the “Save” button to create the monitor.
Step 8: Viewing Monitor Results
- After your monitor has run for some time, you can view the results in the New Relic UI.
- In the Synthetic Monitoring dashboard, you’ll find valuable performance metrics, including response times, availability, and any potential errors or failures.
- Use interactive charts and graphs to analyze trends and identify performance bottlenecks.
Step 9: Setting Up Alerts
- To ensure prompt action in case of performance issues, you can configure alerting policies based on the monitor results.
- Define alert conditions and the notification channels (e.g., email, Slack) to receive alerts when specific thresholds are breached.
- Fine-tune alerting policies to avoid false positives and ensure timely notification of actual issues.
Step 10: Integrating with Dashboards
- Leverage New Relic’s features like dashboards and Insights to integrate synthetic monitoring data with other monitoring data for a comprehensive view of your application’s performance.
- Create custom dashboards to visualize key metrics and gain deeper insights into your application’s behavior.
- Combine synthetic monitoring data with APM and infrastructure monitoring data to correlate frontend and backend performance.
Conclusion
Synthetic monitoring in New Relic is a crucial tool for ensuring the reliability and performance of your applications from various geographical locations.
By simulating user interactions and regularly monitoring key metrics, you can proactively identify and address performance issues before they impact end users.
Setting up synthetic monitoring involves a few straightforward steps, but the insights gained from this practice can be invaluable for maintaining a high-quality user experience and meeting service-level objectives.
Always keep track of your application’s evolving needs and adjust your monitoring strategy accordingly for continued success.
Faq’s
Q: What is synthetic monitoring in New Relic?
A: Synthetic monitoring in New Relic is a feature that allows you to simulate user interactions to monitor the availability and performance of your applications from various locations.
Q: What are the different types of monitors available in New Relic?
A: New Relic offers four types of monitors – Ping, Simple Browser, Scripted Browser, and API Test – each designed for specific monitoring needs.
Q: How do I set up a Ping monitor in New Relic?
A: To set up a Ping monitor, provide the URL or IP address to ping for availability, configure alert thresholds, and select monitor locations.
Q: Can I simulate user interactions with Scripted Browser monitors?
A: Yes, Scripted Browser monitors allow you to create complex scripts in JavaScript to simulate user interactions like page navigation and form submissions.
Q: How often can I schedule a monitor to run in New Relic?
A: You can schedule monitors to run at various intervals, including every 5 minutes, once an hour, or with a custom frequency.
Q: Can I integrate synthetic monitoring data with other New Relic features?
A: Yes, you can integrate synthetic monitoring data with New Relic dashboards and Insights to get a comprehensive view of your application’s performance.
Q: How does New Relic alerting work for synthetic monitors?
A: You can set up alerting policies based on monitor results to receive notifications through various channels when specific thresholds are breached.
Q: Are there any best practices for writing effective scripts in Scripted Browser monitors?
A: Yes, it’s essential to test scripts thoroughly and include proper error handling to ensure accurate simulation of user interactions.
Q: Can I monitor APIs and validate responses using API Test monitors in New Relic?
A: Yes, API Test monitors allow you to monitor API endpoints and validate responses based on specific criteria, such as status codes and response times.
